OSM Renderer for ArcGIS

Hi all,

I think this first post by me on these forums, may actually send a minor shock wave through the OSM community, that may reverberate for a while… (but I may well be grossly over-estimating this ;))

During the past half year I have been working zealously on an “OSM Renderer for ArcGIS”. I think the results are now so good, that they are finally presentable to the world.

***** Please note this is an early announcement, the actual toolbox, is not yet available online. ***** See entirely below also.

The OSM Renderer for ArcGIS depends on ESRI’s ArcGIS for Desktop, and especially ESRI’s Open Source “ArcGIS Editor for OpenStreetMap” as hosted on GitHub (https://github.com/Esri/arcgis-osm-editor). It extends ESRI’s editor with an option to create “Topographic” style maps of OpenStreetMap data, and output these using the standard options of ArcGIS for Desktop to PDF as 100% vector based output for high quality professional offset printing, or just for fun to your own desktop color inkjet printer… While the idea of a “Topographic” style map based on OpenStreetMap data may seem outrageous for those of you living in countries where hardly anything besides roads has been mapped yet, many parts of the world, and especially in Europe and in the vicinity of larger cities and towns world-wide, do provide more than enough “content” to create a convincing “Topographic” map.

Please note that I build this renderer from scratch as a personal project in my spare time, but this is not an “afternoon-tea” project - far from it! For anyone who ever attempted to do this (and I think there aren’t that many out there…), you know how hard this can be, and the plethora of issues to deal with considering the open data model of OpenStreetMap. Kudos to those of you who were, and are, involved in the development of the default OpenStreetMap CartoCSS / Mapnik renderer of OpenStreetMap, despite sometimes regretted but understandable issues once you get down to the technicalities, I still think it is a phenomenal job! It is hard to deal with the specifics of the OSM data model in rendering at times, and to “de-clutter” the map at a specific scale for rendering, or to prevent labels from appearing quadruple or more because features may appear in multiple “layers” worth labeling (historic, landuse, etc.)… To build this renderer, I have therefor read many Wikipedia pages to understand OpenStreetMap’s data model, and make conscious decisions about how to tackle rendering issues. In addition, I had many excursions to the OpenStreetMap website, Tag Info and Overpass Turbo (these are some freaky powerful tools by the way…) to compare my rendering results with those of Mapnik / CartoCSS and info about tag usage, and adjust rendering rules based on observations and mismatches.

The OSM Renderer is implemented as a combined ModelBuilder / Python toolbox. It depends on the above mentioned ESRI toolbox for preliminary data preparation and extraction of attributes from *.OSM files and creation of an ESRI Geodatabase, but enhances this with OSM rendering rules and automated data processing, to build the topographic styled map. It makes extensive use of SQL Definition Queries, Symbol Level Drawing and (Maplex) labeling options, including label expressions. The OSM Renderer for ArcGIS cartographic styling is loosely based on CartoCSS / Mapnik rendering, but there are some major adjustments. I have made a serious attempt though, to stay “true” to the default OpenStreetMap website rendering, so things should look quite familiar to all of you… There is no usage of web-components or pre-existing style sheets (I “copied” OSM standard colors by hand using RGB values), and it is therefore a pure Desktop solution not in need of any ArcGIS for Server components. Processed data is stored as Feature Classes in either an ESRI File Geodatabase, or an Enterprise Geodatabase (PostGIS, Oracle, SQL Server etc.). But I still need to test this latter option, although I don’t see a reason why it shouldn’t work, except possibly an IO performance bottle neck.

To extent on this, and very importantly, the “renderer” deals with the most difficult parts of OSM rendering, that is, for example, proper display of roads and railways in terms of what runs below or over other roads or railways (viaducts, bridges, tunnels). Another of such rendering examples, is that it will filter out any below ground buildings and stations based on the OSM “level”, “layer” or “location” key, only displaying above ground ones.

I spend countless, in fact inordinate hours, fine tuning all of this. Despite this, as with any rendering of a data source like OpenStreetMap or for that matter any geodatabase, ultimately, major comprises have to be made. It is just impossible to render everything, nor is it desirable, and rendering issues do exist, most notably the appearance of outline buildings, due to the familiar “tag-on-relationship” versus “tag-on-way” issue. Still, it goes a long way in representing a base selection of the rich data available in the OSM database…

Since my main goal was to create a renderer suitable for creating maps with a topographic style “look-and-feel” at a base scale of about 1:10,000 (extend-able to about 1:50,000), suitable for navigation purposes “in the field” or as touristic base map, I specifically chose not to render any objects to volatile or numerous to make a sensible map at these scales. E.g. while the actual retail function of a building can be safely rendered on a “static” topographic map, as buildings generally maintain such a role for extended / decades long periods, I specifically refrained from trying to depict specific shop types (e.g. supermarket, clothing, grocery) or shop names on the map. There are just to many of them, and they come and go by the dozens in an average city in an average year. Nor do you ever see them for similar reasons on official topographic maps, which aim for a readable map suitable for navigation, which is also the goal of my OSM Renderer for ArcGIS.

The renderer is not a full “multi-scale” renderer as the default rendering of the OpenStreetMap website is, I specifically developed the tools for printed output in a specific scale range (although a future web service based on all of this, isn’t a phantom). That said, the maps of Rome (1:10000), St. Petersburg (1:25000) and Interlaken (1:50000) actually show that, with some caveats, e.g. overlapping and not always so nicely rendered railway / highway lines, the rendering can serve up the most wanted and used “topographic” scales. I implemented some limited measures, e.g. setting display scales for a few specific Feature Layers or labels in ArcMap, to facilitate this.

The styling, as said before, is loosely based on CartoCSS / Mapnik, but I did take the freedom though to include some enhancements or changes compared to the basic OpenStreetMap rendering. Some features of the OSM Renderer for ArcGIS that you may note once you start exploring the maps I included in this post:

  • More distinction in building types. Buildings with retail function, offices, industrial, warehouses, garages, sheds, greenhouses / glasshouses etc., now all have a specific rendering, allowing you to for example “spot” the main “Kalverstraat” shopping street in a city like Amsterdam, or the huge garages complexes in Saint Petersburg at the borders of quarters of the city.
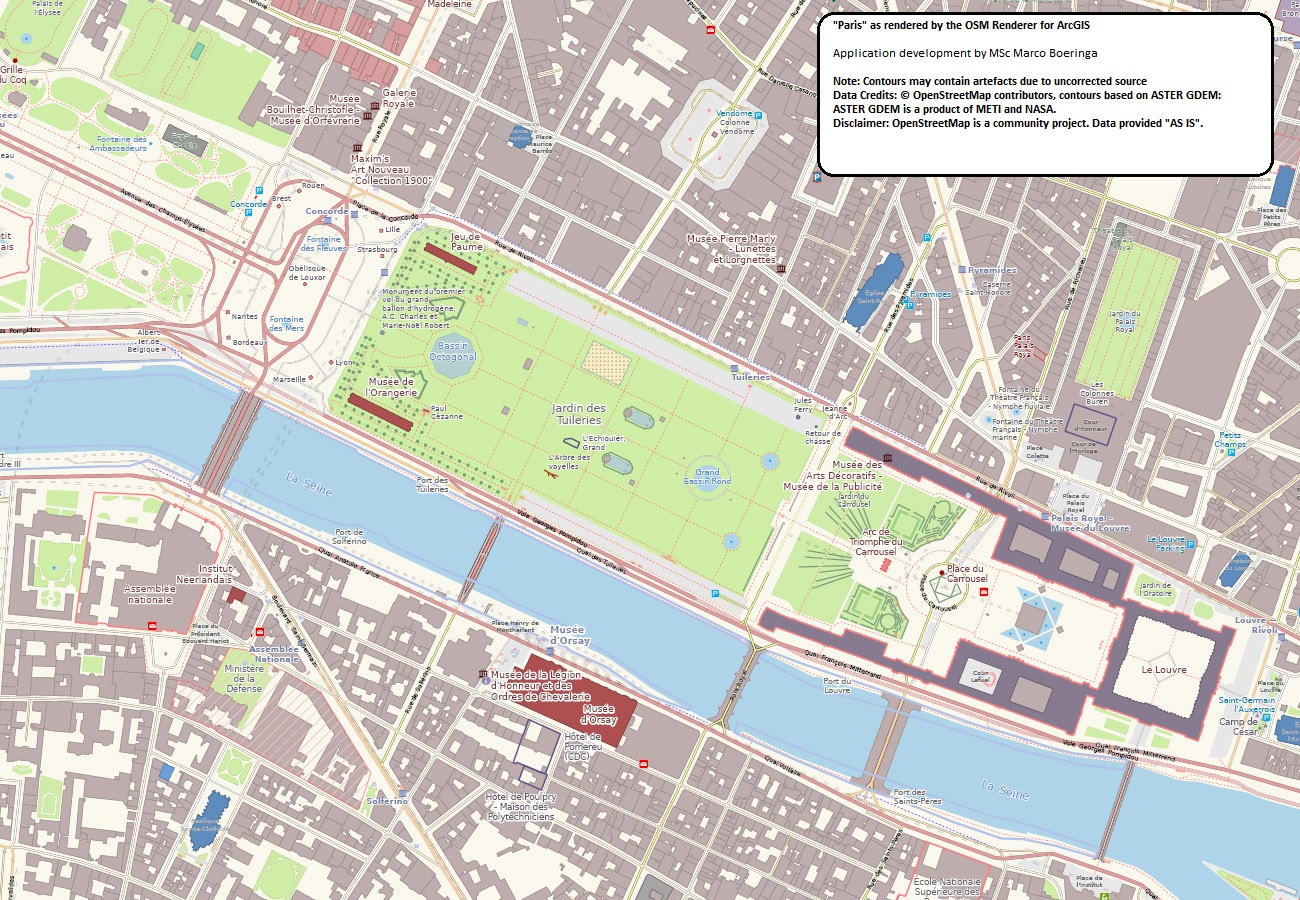
  • Specific emphasis for many historic and tourism related features. Things like attractions, museums, castles and palaces, now pop-up on the map due to the use of a distinct color (salmon-dark red for attractions, purple for historic). Especially see the “Rome” or “Paris” maps for this.
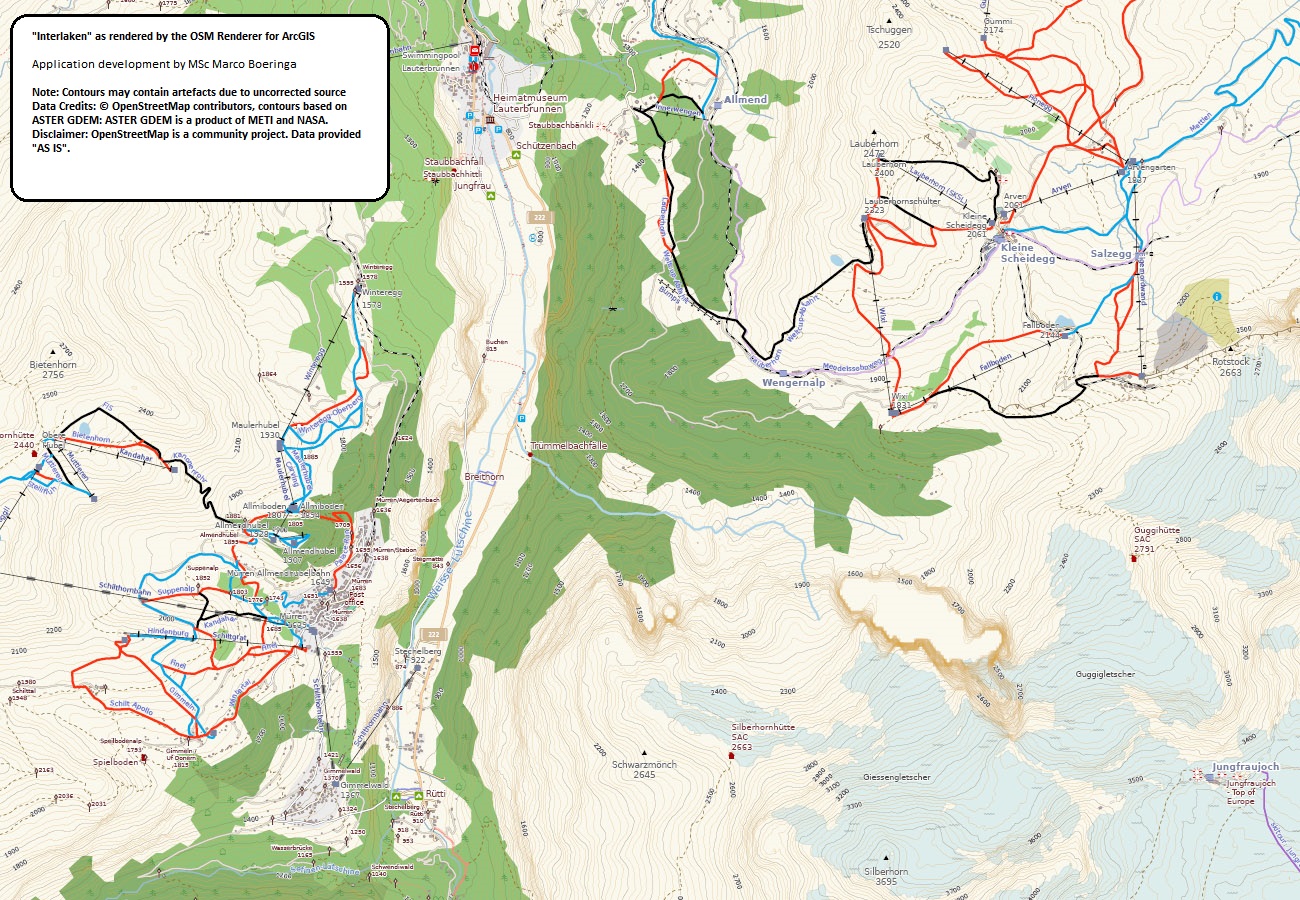
  • Rendition of many of the “ski” / “hike” features in alpine regions, including different symbols for different types of aerialways, pistes for downhill and nordic etc. In addition information elements like guideposts and information boards / maps for hikers. See the “Interlaken” map for this.
  • More distinction in railway types. Sidings, spurs and yards are depicted differently from main lines, while subway and light rail also feature specific symbology compared to main line.
  • Support for many of the features of the approved new “Power” scheme, see the “Rotterdam Harbour Mouth” map and the E.ON power station there, that implements some of this in its OSM tagging. I am still working on some aspects.
  • A possible revelation, and maybe world’s first?, is a comprehensive legend of all features rendered by an OSM renderer. It certainly reveals the complexity of the OSM data model, and why questions by users like “Why does Mapnik not render X/Y?!/ Why don’t I see this new tag X/Y that I entered in my OSM editor immediately displayed on www.openstreetmap.org?”, are not so easily answered…

This is just a glimpse of the work I have done, start exploring the maps and let me know what you think! I recommend you to zoom in at 125% in Adobe Reader. This will let you both appreciate the detail rendered, and keep a bit of an overview. The renderer literally renders hundreds of different features. One note though: although you may think that the roads are displayed “thin” if you are used to OpenStreetMap web map rendering only, they actually are close to real world widths (disregarding the “boulevard” type city roads like in Paris, or six lane highways encircling cities), as in true 1:10,000 scale topographic maps, and they will look fine and normal in a printed map. I have included both two screenshots here to “whet the appetite” and a direct link to one PDF, and the other maps in ZIP files for an easier and more reliable download. They cover a number of well-known cities and areas around the globe and are the real, direct output, of my toolbox (well, the rendering part of it, not the map layout with legend and such). The “Interlaken” map is a special case though, it has been enhanced with the addition of ASTER satellite GDEM V2 based contours, that I created myself from the raw raster data as download-able from NASA, similar to OpenCycleMap.

Some of you may regret the fact that I didn’t build this in Open Source QGIS, but although I have recently begun to explore QGIS and really liked what I saw, the fact remains I have vastly more experience with ArcGIS, than QGIS. I leave it to someone else to come up with a QGIS equivalent… In addition, my tool focuses on the actual rendering aspect of OpenStreetMap data in ArcGIS, and leaves the heavy job of processing and creating the base Polygon / Polyline / Point ArcGIS Feature Classes from OpenStreetMap data, to the already existing tools ESRI provided to the community. My renderer takes these as input.

Lastly, I think once you see the results, you will love it whatever your personal choices and uses of OpenStreetMap data and related editing and web application software are (well, at least I hope so… ;)).

Yes, you may print these maps, it is your (or should I say “our”?) data… Please do not(!) ask me to render your city, town or area. I can not possibly provide such a service on my own.

I am currently in direct contact with ESRI Redlands, to see what we can do to make this available to the entire OSM community, and possibly benefit from cooperative development to finish this personal project and optimize the needed data processing and integration of these toolboxes. These contacts are still in a pre-liminary stage though, so bear with me, it will take some time.

Whatever happens, I think however, that there is a place for both a “topographic” rendering like mine, and the rendering by CartoCSS / Mapnik. Where the default OpenStreetMap rendering excels in multi scale display, and display of objects and labels to the very finest detail, gives my map renderer a more “faithful” rendition in terms of real world size and scale of objects, as expected from topographic maps.

Lastly: have patience… Despite the current results, it will take some serious time before this can be finally “released”. There is still a significant “TO DO” list, and documentation needs to be written. These are absolutely not things to rush, I don’t want to release something half-finished or with significant “rough edges”, nor could I ever do them overnight.

Please post any comments and questions you may have here on the forums!

I hope you will enjoy exploring these maps as much as I did, it was a real pleasure and excitement to see maps of previously unexplored areas being rendered of the downloaded data, and appear on screen in full glory in the PDFs. Note that the PDFs are big, between 6-20MB, consider this before downloading if you are on a severely limited internet connection. They are full size A0(!) layouts, so extremely rich in topographic detail.

Marco Boeringa
The Netherlands

***** WARNING - Adobe Reader - WARNING *****
Adobe Reader, needed for viewing these PDFs, has an option for “enhancing” thin lines. This option causes especially railway tunnels, but also other thin line objects, in the below linked maps to show up very ugly on screen, with much over-emphasized appearance. Unfortunately, Adobe has made this bad option of “enhancing” thin lines default. I strongly recommend disabling it before reviewing these maps. The option can be found under Edit / Preferences / Page Display and than under Rendering / Enhance thin lines. Switch this option off before reviewing the maps.

I also strongly urge you to download the maps locally for the best viewing experience both for performance and quality reasons. Even though the Roma map can be viewed directly in the Adobe Reader in your browser using the link below, its display will suffer as the plugin handles things differently (and worse) as compared to the offline viewer.


Italy-Rome
http://www.boeringa.demon.nl/OSM/OSM_Italy_Rome_1_10000.pdf
France-Paris
http://www.boeringa.demon.nl/OSM/OSM_France_Paris_1_10000.zip
Germany-Koln
http://www.boeringa.demon.nl/OSM/OSM_Germany_Koln_1_10000.zip
Russia-Saint Petersburg
http://www.boeringa.demon.nl/OSM/OSM_Russia_Saint_Petersburg_1_25000.zip
Switzerland-Interlaken
http://www.boeringa.demon.nl/OSM/OSM_Switzerland_Interlaken_1_50000.zip
United Kingdom-London
http://www.boeringa.demon.nl/OSM/OSM_UnitedKingdom_London_1_10000.zip
United States-San Francisco
http://www.boeringa.demon.nl/OSM/OSM_UnitedStates_San_Francisco_1_25000.zip
The Netherlands-Amsterdam
http://www.boeringa.demon.nl/OSM/OSM_TheNetherlands_Amsterdam_1_10000.zip
The Netherlands-Amsterdam Schiphol Airport
http://www.boeringa.demon.nl/OSM/OSM_TheNetherlands_Amsterdam_Schiphol_Airport_1_10000.zip
The Netherlands-Rotterdam
http://www.boeringa.demon.nl/OSM/OSM_TheNetherlands_Rotterdam_1_10000.zip
The Netherlands-Rotterdam Harbour Mouth
http://www.boeringa.demon.nl/OSM/OSM_TheNetherlands_Rotterdam_Harbour_Mouth_1_25000.zip
The Netherlands-Zuid Kennemerland
http://www.boeringa.demon.nl/OSM/OSM_TheNetherlands_Zuid_Kennemerland_1_25000.zip

***** New maps (06-09-2014) *:

The Netherlands - Nieuwe Hollandse Waterlinie - Utrecht
http://www.boeringa.demon.nl/OSM/OSM_TheNetherlands_NHW_Utrecht_1_25000.zip
The Netherlands - Nieuwe Hollandse Waterlinie - Gorinchem
http://www.boeringa.demon.nl/OSM/OSM_TheNetherlands_NHW_Gorinchem_1_25000.zip


Hi Marco,

I just found your post via the german “weekly news”. And I have to say that I’m really impressed by the results! The maps look amazaing and I think your style is not just “loosely based” on Mapnik, it is superior to Mapnik.

As to the number of replies so far you should know, that users of ArcGIS are not quite the audience of this forum. Also there are not much OpenStreetMappers using ArcGIS (that’s a guess ;)). Most of “us” are not used to the commercial/proprietary GIS world after all.

Anyway, our local OSM group is cooperating with the GIS department of our city and they asked us, how they could draw good OSM maps using ArcGIS :slight_smile: So it will be exciting to tell them the news, especially once your code is released :wink:

And yet - I read your reasoning - it would be great if you eventually port your renderer to QGIS or a similar open source tool.

Peda

Just a quick word - I like your style as well and look forward to a release. Keep up the good work!

Best wishes!

Hi, sorry for the late reply, but I have been on a small holiday.

Thanks for the compliment, but I wouldn’t use the word “superior” myself. Although I may have solved a couple of issues in a more “appealing” way, in the process, I have needed to ditch maybe 75% of all objects CartoCSS / Mapnik renders (if I count all the shops and such), and maybe >95% of all labeling compared to Z18… And I haven’t even made an attempt to deal with routes, multi-lingual labeling problems, or the important “place” and geographic “boundary” (countries, provinces, municipalities etc.) issues to name a couple of things.

It is a bit like comparing apples and oranges… CartoCSS / Mapnik rendering was designed for high readability on small mobile devices screens, and for showing “everything” (well better said “a lot”…) down to the last waste bin at Z18. That is not the goal of my renderer. Although I am still adding more rendering rules, I don’t intend to rebuild it to a full multi-scale renderer like CartoCSS and Mapnik. That said, the “framework” I have set down for this, is quite extend-able, so if anyone wants to add rendering rules, it will be possible.

My renderer also suffers from many of the same issues the CartoCSS / Mapnik developers have to deal with, and I have come to the conclusion that we actually, not entirely unsurprisingly, have developed “similar” approaches to deal with some of the (multi-scale) issues. Through my work, I have also become fully aware of the tremendous effort to build such a “multi-scale” renderer. My tool only focuses on a specific scale range, which somewhat eases the cartographic task, the issues more than quadruple for a multi-scale approach like CartoCSS / Mapnik’s… Although this may have been mis-interpreted, I certainly wasn’t being ironic when I gave credits to the CartoCSS / Mapnik developers in my first post here in this thread.

I was fully aware of the current status of ArcGIS as an editing environment for OpenStreetMap data, and agree with your observations. I think ArcGIS could get a bigger role though as a cartographic tool for OSM data, once this gets released, and possibly a server environment, through use of ArcGIS for Server.

Yes, they will be able to make good usage of this once it gets released.

I think that is for someone else to do… My tool will give some guidance as to a - possible - approach to realize this in QGIS too. Actually, funny enough, I noticed quite some similarities between ArcGIS and QGIS in some of the interface and GIS specific things, seems some of the QGIS developers had some good looks at ArcGIS too… (or the other way around - IDK, think of Symbol Level drawing, Definition Queries and a QGIS “Model Builder” equivalent) which will help in re-developing something similar for QGIS.

Actually, there seem to have been activities in this direction of using OSM vector data directly symbolized / rendered in QGIS already back in 2011, judging from for example this page: http://hub.qgis.org/projects/quantum-gis/wiki/Using_OpenStreetMap_data. I don’t know however what became of that…

Marco

I have decided to upload some updated maps to my website. The links in the first post now display these. I have made many small changes to enhance the display. Many of the changes may not be very obvious though, as these are rather subtle, but you will notice them if you compare the old and new maps side-by-side (old maps are no longer here in the thread though, as said the links point to the new ones):

  • Some changes to the roads layers, including a wider secondary road line, and slightly widened casing for other types to make them a bit more pronounced

  • Partial implementation of power=substation. Substation are now displayed via an outline, I still need to make distinction between buildings and open-air ones. Power lines now clearly and unambiguosly end at substations where lines likely go underground, instead of raising the question whether a power line was not completely digitized because it abruptly ends “somewhere”. It sure is nice to see for example power lines end near big water bodies that need to be crossed underground due to large shipping vessels traffic, such as in the Rotterdam Harbour Mouth map.

  • Better implementation of medical facilities as high priority items. Hospital and clinics are now almost in all cases being displayed, whether only the building, the hospital or clinic grounds, or both are tagged, and irrespective of in amenity or building. Hospitals also take precedence over clinics by a more pronounced icon. An exception is for hospitals and clinics that having emergency facilities: both have a pronounced icon, clinics feature a square icon instead of a round one though.

  • More icons for closed ways with important features. Not all police stations, post offices, toilet buildings etc. had icons, now most do. ArcGIS will add an icon via labeling (which is actually a non-standard feature of ArcGIS).

  • Railway platforms now have labels parallel to tracks, so most tracks now get labeling on big stations (only at scales 1:10000 and larger).

  • Railway tunnels are labeled by name, so subway lines in London are now named visibly on the map (which also revealed an issue, since I see “Disused” lines being rendered, maybe I should remove these?).

  • Man_made=crane is now being rendered, so you can now see cranes in the Rotterdam harbour…

  • More minor adjustements

Lastly, I noticed some layers were actually missing in the legend, including a vital one like landuse=*. I have added these. It is a pretty difficult legend object to handle in ArcGIS with so many layers, so an oversight is unfortunately easily made…

I have now updated the Paris PDF map to show single natural=tree as well. Previously, it only showed natural=tree_row. Now, the wide spaces between buildings and roads, finally make sense :slight_smile:

Enjoy this latest version of the Paris map! (see the download link in the first post in this thread)

I haven’t yet done this exercise for all the other maps though, but I guess Paris is a prime example of the tree lined avenue…

Hello Marco,

it seems that your project is growing and getting better!

So far I cannot find any article about it in the OSM wiki … is that correct, or I did not find it?

Because to give a description and examples about those rendering capabilities, the OSM wiki is a very good place!

So what about creating a wiki page about OSM Renderer for ArcGIS ??

I think you can grow the user group to test and evaluate your efforts, and get more feedback.

Have a look at similar software projects in the OSM wiki if you need a kind of template.

Thanks, and you’re right there is no Wiki page yet. But as I tried to explain in my first post, the actual toolbox is not yet available online either. My references to the Github repository are refering to ESRI’s work, which forms the basis of my tool. My OSM Renderer for ArcGIS toolbox takes ESRI’s OSM geodatabase output as the starting point for the renderer. So it “extends” ESRI’s toolbox, it is not yet part of it (I am developing this private up to now).

As explained above, this is not yet possible, since I didn’t release it yet. As to the reasons why? There are several: I am still in the middle of developing rendering rules, and don’t want to release it preliminary. More importantly though, there are some issues with ESRI’s toolbox and how it handles some polygon objects, and potential optimizations to combat performance issues on very large extracts from the OSM database, that warrant discussion with, and can only be solved, in close collaboration with ESRI. As I wrote in my first post, I have contacted them, and anticipate working together with them to finalize this. This is the main reason I don’t yet want to release it, but I do intend this to become available to everyone in the long run. Just have some patience.

Marco

I today discovered I had actually uploaded an old version of the Paris map a second time, without the trees. So for those of you who wondered why nothing much seemed changed and so many trees seemed missing compared to the OSM default styling, that is the cause.

I have now uploaded the proper map, and you can now see rows of trees for example encircling the Arc de Triomphe.

Adobe Reader warning
Adobe Reader, needed for viewing these PDFs, has an option for “enhancing” thin lines. This option causes especially railway tunnels, but also other thin line objects, in the below linked map to show up very ugly on screen, with much over-emphasized appearance. I strongly recommend disabling it before reviewing the map. The option can be found under Edit / Preferences / Page Display and than under Rendering / Enhance thin lines. Switch this option off before reviewing the map.

France-Paris
http://www.boeringa.demon.nl/OSM/OSM_France_Paris_1_10000.zip

Marco

Another progress report on the development of the OSM Renderer for ArcGIS. I have again made many subtle but vital changes. The changes may not be immediately obvious, but with the guidance below, you will spot them.

This time, I have updated all of the maps of all the regions/cities to reflect the latest development state of the renderer! The links in the first post here in this thread now all link to the latest maps. I have also updated the legend to reflect all this.

  • much improved SQL rendering rules for polygon features / closed ways of ice_hockey, ice_skating / skating and sport=swimming / amenity=swimming_pool / leisure=swimming_pool facilities. The rendering rules now capture a lot more of these facilities, and hence you see them much more often make appearance in the maps. Indoor (building=yes or covered=yes) facilities are now distinguished from outdoor facilities (if properly tagged of course), and outdoor swimming_pool now includes all pools, whether private or public (Indoor swimming is restricted to public facilities only), so private pools in gardens of private houses should be visible. You can see several examples of swimming facilities in the updated Paris map (look for features labelled “piscine” in light cyan colour), and in almost all of the other maps.

  • improved SQL selection rules for public transport facilities, especially railway stations. Partial implementation of the “public_transport” schema / key to capture railway stations tagged in this manner, but I have to admit, this tagging scheme is a bit of nuisance in rendering, as it complicates rendering and SQL.

  • bus_station with building = ‘yes’ is now rendered distinctly from normal buildings and in slightly lighter hue comparable to train stations, as these usually represent a major transport hub too.

  • improved rendering for polygon features of (water) reservoirs. Covered reservoirs are now no longer hidden beneath building polygons, if the covered aspect of the reservoir was set by “building=yes”, instead of “covered=yes” or by using the special tag man_made=reservoir_covered. Covered reservoirs now show up in a more distinct symbolization compared to “open air” reservoir, and no longer suggest open water. There are some really huge (historic) ones in Paris, but not visible in the map I rendered. Smaller ones though, and huge ones in San Francisco, are visible.

  • barrier=wall is now being rendered. You can see some nice rendering of this around the Cathédrale Saint-Louis des Invalides in the Paris map. Walls are depicted by a light grey thin line with a dark grey stipple on top. This is probably a rather unusual depiction, but makes them more easily distinguishable from things like railway tracks, that may feature thin greyish lines too (in case of sidings, spurs and yards). I think it is also enough distinct not to be confused with footpaths.

  • building=roof is now rendered. I chose to render this with an open cross hatch line pattern, allowing you to “see” through the roof. This works out quite nicely in the Rotterdam Centraal Station, and Roma Termini, where the structure of the station building complex is much more clear, and, in the case of Rotterdam Centraal Station, you see which parts of the tracks are covered. Also nice is the rendering of the probably glass covered inner courts of the Louvre in Paris, although it now seems that at least one of the courts on the south side is unjustly tagged as “building=roof” when compared to Google Maps imagery. WARNING: this tag is not for “ordinary” roofs. The tag is for open sided roofs, where the roof structure itself may in some cases be the entire “building”, like with a petrol station, or the track covering parts of railway stations.

  • I have decided to push back rendering of train stations building polygons below railway tracks of layer >= 0. This is more in line with how CartoCSS/Mapnik rendering on the main OpenStreetMap website displays train stations, and prevents confusing rendering orders where some tracks may appear to be on top of the building due to for example layer = 1, while others may appear “inside” or below the building due to layer = 0, as the old rendering occasionally showed. Although this is a tagging issue, the new rendering does provide a more pleasant and consistent view, and allows you to view the track layout inside the rail station, which is of value by itself. The drawback is that you no longer can see if tracks are covered by a building (roof), but the tagging associated with stations and railway tracks, doesn’t actually provide a real good consistent way to solve this ordering problem anyway (there is no guarantee that a building layer = 1 is above a railway level 0 from a technical and logical point of view using the current tagging schemes). A better solution to this is to define a “building=roof”, like the examples pointed out in the above section.

  • single trees are now rendered slightly less conspicuously. Although the rigid lines of trees in a map like the one from Paris, were nice to see, this was less so for “random” trees in English style parks. The trees now also blend in better with polygon areas of woodland / forest, as the difference in hue is smaller.

  • embankments and cuttings are now being rendered, both as 1) stand-alone double sided features not associated with a highway or railway but a way with “embankment=yes” or “cutting=yes”, and 2) on highway / railways with the tag “embankment=yes” or “cutting=yes”, and 3) as single sided embankment as per the definition of the “man_made=embankment” tag. Choosing the way to render this, wasn’t easy, especially for embankments on railways, as the rendering may cause a serious visually unpleasant clutter of embankment symbols in between parallel tracks, very common in railway tracks. I partially solved this, by giving embankments and cuttings an interior fill, which leads to a much more pleasant appearance with parallel tracks, as the embankments can “merge” visually if close enough. There are no good examples of this in the maps I present here, due to lack of tagging, but I have seen an acceptable rendering in a part of Amsterdam that contained parallel tracks individually tagged as embankments. A nice example of a stand alone single sided embankment/cutting rendering, is in the historic fortified town of Brielle in the Rotterdam Harbour Mouth map.

  • power=solar_photovoltaic_panel now has a more easily recognizable symbol. You can see nice examples of this on some of the buildings of Vatican City in Rome, and a very large one on London Blackfriars station over the Thames. Actually, this last example could do with a make over in OSM, as the real sections of solar_photovoltaic_panel are much smaller and divided into pieces on the roof of the building. The current way representing this seems very coarsely digitized, not even following the outline of the better detailed station / bridge building below it.

***** OSM CHALLENGE *** *** OSM CHALLENGE *** *** OSM CHALLENGE *** *** OSM CHALLENGE *****
I guess there may be people out there who would love to see their city or area rendered by my OSM Renderer for ArcGIS, especially if it is well tagged. Now is your chance! :wink:

I hereby set a challenge: the first person that finds a “man_made=crane” situated on top of an embankment in one of these maps I linked in my first post here in the thread (http://forum.openstreetmap.org/viewtopic.php?pid=439704#p439704), and manages to post a screenshot of it here in the thread pointing it out, or who manages to give an exact textual description of where it is located and in which map, may decide on an arbitrary region on the globe he / she wants rendered at A0 (in the scale range of 1:10000 to 1:50000 scale). I will then download this region or city, and render it in ArcGIS, and post the result here as a link for anyone to download.

Hi Marco, mooi beeld ! compleet ? Heb je een selectie gebruikt, ik mis in Velsen bv nog wel een redelijk stuk muur. Of welke criteria liggen er onder de weergave ?

Alle rendering van OSM is per definitie een “selectie”. Alleen als je op de hoofdsite van OSM bij de Lagen voor “Kaartgegevens” kiest, krijg je echt alle gegevens te zien. Dus ja, het kan zijn dat mijn huidige selectie iets nog laat liggen. Dit kan overigens ook een “tagging” probleem zijn, waarbij er wellicht “voor de renderer” is getagged met een foutieve tag, die echter wel visueel het juiste resultaat geeft. Denk b.v. aan het gebruik van barrier=hedge i.p.v. barrier=wall om maar een dwarsstraat te noemen.

Als je exact kan aangegeven waar het is (zoom in op het object in OSM en selecteer het zonodig, kopieer vervolgens de link uit jouw browserbalk en post die hier, die geeft namelijk de exacte locatie aan van het window waar je dan zit), dan kan ik proberen het te fixen door, wanneer noodzakelijk, mijn renderer aan te passen.

Het zou trouwens wel mooi zijn als ook b.v. de gigantische snelbotenbunker een “name” tag mee zouden krijgen. Zonder name tag, geen label, en dat is toch wat jammer. Opname van een naam in andere tags heeft geen zin, want die worden niet gerenderd (ook niet op de hoofdpagina van OSM). Het is echt onmogelijk om uit alle honderden mogelijke keyvelden, een zinnige selectie van tags bruikbaar voor labeling te maken. Een mens kan misschien begrijpen dat er een andere tag nodig is als je de gegevens van een object bekijkt, maar een computer niet, die is dom… Daarvoor is echt de “name” tag bedoeld, evt. aangevuld met de “ref” tag, want die heeft ook nog een duidelijk omschreven doel voor coderingen (die render ik in specifieke situaties ook, zoals b.v. op de wegen, misschien moet ik dat ook voor de bunkers gaan doen, want die hebben ook vaak een nummer/code). Het is mij niet duidelijk waarom die naam hier niet is meegegeven. Kleine fix in OSM…

Marco je hebt het al gevonden. De muur aansluitend op de tankgracht (ook gerenderd) wordt de tankmuur weergegeven maar meer zuid oost 2 gracht delen verder was ie verdwenen, nu mager aanwezig. Ik kijk nog wel uit naar een methode om de bijschriften niet door de onderwerpen te krijgen. Zo leverde ik geen werk af, maar het kan misschien wel niet geautomatiseerd. Maar 3 keer Forteiland is duidelijk overdone, maar dat zit in de database.
Gevraagde link, http://www.openstreetmap.org/#map=16/52.4412/4.6199 de groene stippen aan de onderkant van de gracht zijn putjes langs de tankgracht.
Het verschil in weergave van de Drakentanden, http://www.openstreetmap.org/#map=17/52.44542/4.57098 paars en grijs kan ik niet verklaren. Succes.

“Zo leverde ik geen werk af”.

Dit klinkt alsof je een gepensioneerde CAD tekenaar bent, is dat zo? Ja, ik snap dat als je vroeger met CAD of Adobe Illustrator hebt gewerkt, en daarbij duizenden labels handmatig perfect hebt kunnen plaatsen, dat automatische labeling zoals hier in ArcGIS gedaan, nog wel eens wat tegenvalt. Maar daar staat wel wat tegenover: i.p.v. dagen, weken of zelfs maanden aan 1 kaart te werken, draai ik nu in een halve dag heel Nederland in schaal 1:25000 uit, nu de database daarvoor klaar is… :sunglasses: Ergens moet er dan een compromis zijn, maar ik denk dat ik toch al aardig wat moeite heb gedaan om de labeling enigzins acceptabel te laten verlopen, en zoveel mogelijk doublures en ernstige overlappingen, te voorkomen. Maar de Maplex labeling engine van ArcGIS, is natuurlijk niet feilloos… :confused: (nog ben ik dat…)

Ik heb overigens wel ook nog een kleine aanpassing in de labeling gemaakt, waarbij iets meer ruimte tussen het object en het label wordt geschapen. Moet de kaartlink echter nog bijwerken, dus niks te zien nu.

Dat zit waarschijnlijk inderdaad in de database, hoogstwaarschijnlijk gekoppeld aan verschillende thematische lagen (dus b.v. “building” en “landuse”). In dat geval, kan de Maplex label engine helaas niet goed doublures verwijderen, omdat voor zover ik dit heb kunnen ervaren, dit alleen goed werkt binnen 1 ArcGIS “layer”, en ik scheidt die thematische lagen nu juist in verschillende “layers”… De doublures worden daarmee niet verwijderd. En dit is misschien ook wel terecht, want het is eerder een OSM tagging probleem. Als er al een outline rond het fort is getekend met daaraan “Forteiland Ijmuiden”, dan moeten niet ook andere objecten binnen die outline, dezelfde name meekrijgen… daar ligt dus ook een oplossing: verwijder nodeloze tagging, en vervang die zonodig door meer specifieke (b.v. bunkernaam).

Ik snap helaas niet wat je bedoeld met “de groene stippen”, ik zie ze niet?.. En watvoor “putjes” zijn dat dan? Voormalige schutterputjes die op de kaart te zien zouden moeten zijn?

1 van de drakentanden vlakken (de meeste rechtse van de drie in de linkersectie van de tankmuur gelegen) heeft een typefout in de tagging. Er is “historic:perod” opgenomen, ipv “historic:period”. Dus niet als “historic” herkend in mijn renderer, want ik check voor die hele string…

Overigens is hier een beetje “voor de renderer” getagged. anti_armored_vehicle_barrier is geen building (noch is die eerste tag een op dit moment gedocumenteerde tag in de Wiki als ik het goed heb), toch staan ze er zo in… ik snap het wel, want anders is er niets te zien omdat de style het waarschijnlijk niet ondersteund als vlak (ik trouwens ook nog niet in mijn renderer), maar helemaal correct is het niet… Vraag is ook of je hier perse vlakken moet hebben, maar ik begrijp dat ze hier in een groot betonvlak zitten. Misschien is er iemand anders hier op het forum, die een betere, meer reguliere, tagging kan suggereren voor een dergelijk betonvlak…

I have now created two new maps that people can explore. Both maps, among other things, also show the effect of the new rendering rules for embankments and cuttings on highway and railway lines, and single and double sided embankments not associated with a highway or railway. You will find examples of almost all of these in the two maps below.

In addition, these maps show some interesting historical objects, in the form of the chain of 18-19th century Dutch military fortresses called the “Nieuwe Hollandse Waterlinie”.

The Netherlands, as a country historically to a large extent formed by the activities of the delta of the river Rhine, and positioned at the coast, always has had the need to protect itself against floods. Less known though, is that controlled flooding or inundation actually has been at the very heart of the main defensive strategy of the Netherlands against invaders for centuries. From the use of inundation as defensive strategy against military raids by the Spaniards during the 80 years war against Spain (1568 - 1648), well up into the 20th century when the Ijssel river defensive line was build during the start of the Cold War (1950’s), this latter defensive line even incorporating left-over WWII military stock in the form of Sherman tanks dug into the ground and sealed with concrete to serve as a make-shift battery…

These maps show the 18 and 19th century fortresses encircling the city of Utrecht, and a more southern section near Gorinchem, in the heart of the delta of the Rhine:

The Netherlands - Nieuwe Hollandse Waterlinie - Utrecht
http://www.boeringa.demon.nl/OSM/OSM_TheNetherlands_NHW_Utrecht_1_25000.zip
The Netherlands - Nieuwe Hollandse Waterlinie - Gorinchem
http://www.boeringa.demon.nl/OSM/OSM_TheNetherlands_NHW_Gorinchem_1_25000.zip

Reminder:
***** OSM CHALLENGE *** *** OSM CHALLENGE *** *** OSM CHALLENGE *** *** OSM CHALLENGE *****
I guess there may be people out there who would like to see their city or area rendered by my OSM Renderer for ArcGIS, especially if it is well tagged. Now is your chance! :wink:

I hereby set a challenge: the first person that finds a “man_made=crane” situated on top of an embankment in one of the maps I linked in my first post here in the thread (http://forum.openstreetmap.org/viewtopic.php?pid=439704#p439704), and manages to post a screenshot of it here in the thread pointing it out, or who manages to give an exact textual description of where it is located and in which map, may decide on an arbitrary region on the globe he / she wants rendered at A0 (in the scale range of 1:10000 to 1:50000 scale). I will then download this region or city, and render it in ArcGIS, and post the result here as a link for anyone to download.

Hoi Marco, k ben benieuwd, tja spelling. Handwerk, zonder chablonen, tot de tijd dat je Autocad nog op een kleine PC kon draaien. Nu wil ik graag een station en lees het resultaat, een ander kan veel sneller werken en loop ik jaren achter, nou ja ik heb nog een 2013 op proef licentie. Bovendien liggen de vector gestuurde lijnen nooit op de door mij gewenste plaats, maar net een streek anders. 1:25000 was ook handwerk, daarom duurde het >10 jaar voor er een nieuwe release kwam.
De putjes staan op OSM in de bewerking mode, als groene stippen, tagged als man_made=pit, hier http://www.openstreetmap.org/#map=19/52.44049/4.62225 , hoe moet je een schuttersputje taggen om van trenches maar niet te spreken, dat blijven lijnen ? Begrijpelijk dat je de putjes niet hebt meegenomen, klein detail.
Voor de drakentanden geldt dat het een complete constructie is, bestaande uit 5 gewapend betonnen balken 1,00 x 0,80 als een kruismat met opstaande tanden, breedte 15,00 m. IMHO is het daarmee een bouwwerk, een huis nee dat niet. Maar dat is de tankmuur op zich ook niet, bij Velsen zitten er kazematten en een poort of doorgang aan vast (bouwwerk), maar bij Bergen niet, slechts een 2,00 m hoge muur met een dikte van 1.00 ? Het staal is hier en daar O 30 mm, bij Wimmenum hebben ze geprobeerd ze te slopen. En nee niet voor de renderer, die zoekt het maar uit (Marco dus), maar de basis zijn verkenningen buiten en onderzoek. Bunkers hebben vaak geen namen en Stekelvarken, en bijnaam is al afgekeurd, dan blijven type of ref over. Dat zoeken naar een betere tag zal nog wel even duren, de Drakentand (Duits) versperring komt in Engeland niet voor. OSM is veel ways en routes en minder details, voorbeeld, staat er bij een Zaans (Noord-Hollands) huis dat het van hout is ? Als er iemand is die een betere tag kent/weet, its OSM be my guest.

Je hebt bij de Topoografische Dienst gewerkt? Hoe dan ook, ben zelf bij de toen nog Meetkundige Dienst ook bij een dergelijke werkproces betrokken geweest. Daar duurde kaart-updating ook een slordige 5 jaar. Ze zaten toen net in een overgangsfase en de noodzaak voor een nieuw werkproces met ArcGIS. Daar heb ik toen nog een bijdrage aan geleverd.

Ik wist eerlijk gezegd niet eens dat ze “op de kaart” stonden. Maar ja, kijkend naar de link die je poste, is dit detail is niet zinvol weer te geven bij een kleinere schaal dan 1:100, dat is extreem… Op dit detailniveau wil ik mij voorlopig nog niet richten. Bovendien vraag ik mij af wat de historische waarde is van deze “schuttersputjes”. Ik kan mij toch niet voorstellen dat de Duitse soldaten in kwetsbare schuttersputjes gingen zitten, notabene recht voor een met tobruks en andere bunkers versterkte tankmuur… Ik zou haast denken, dat deze schuttersputjes een vorm van trainings-tijdverdrijf zijn geweest voor waarschijnlijk aardig verveelde soldaten op wacht op een vijand die hier nooit zou komen…

Dit alles klinkt voor mij meer als een “man_made” tag, dan “building”. Bij building denk je toch vaak aan iets dat op zijn minst toegankelijk is via een deur - een “gebouw”. In ieder geval in de context van OSM, want onder “building” in de Wiki, zie ik eigenlijk alleen “gebouwen”: http://wiki.openstreetmap.org/wiki/Key:building

Toegegeven, in de man_made lijst zitten volgens die definitie van toegankelijkheid via een deur ook veel buildings, maar ook meer “bouwwerken” zonder toegankelijkheid. De “military” key lijkt verder nog niet goed uitgewerkt… Helaas is dat onderscheid tussen gebouw (toegankelijk), en bouwwerk of kunstwerk zoals dat dan bij Rijkswaterstaat heet (beiden vaak niet toegankelijke structuren), in de Engelse term “building” niet goed te scheiden. Building lijkt voor beide te worden gebruikt, en het Engels lijkt het onderscheid tussen een gebouw enerzijds, en bouwwerk of kunstwerk anderzijds, eigenlijk niet echt te maken.

Ref is OK en ook logisch, want die bunkers waren waarschijnlijk wel genummerd cq. gecodeerd, dit render ik nu dus ook voor bunkers.

Overigens vind ik de door jou gekozen barrier=bollard voor de drakentanden nog niet zo slecht. Hoewel de uitvoering anders is dan een gewone “bollard”, is de functie wel overeenkomend. Ik zou het dus bij barrier=bollard houden, en de building=yes tag wellicht verwijderen (maar dan rendert het waarschijnlijk niet).

I have made some further subtle enhancements to the embankments and cuttings rendering, as I wasn’t yet fully satisfied with how it looked. I have adjusted the size of some of the embankment symbols on non-main roads, and removed fill on them. I also removed outer fill of embankments and cuttings on main roads only keeping interior fill. This makes embankment blend in a little bit better with the background, and the embankments less conspicuous. I think embankments and cuttings now work out quite nicely on highway lines (embankment=yes as tag), see for example the motorway junction between the A27 and A12 in the Utrecht map.

I only adjusted the latest new maps of the Nieuwe Hollandse Waterlinie, I did also update the legend of these maps to reflect the changes.

The Netherlands - Nieuwe Hollandse Waterlinie - Utrecht
http://www.boeringa.demon.nl/OSM/OSM_TheNetherlands_NHW_Utrecht_1_25000.zip
The Netherlands - Nieuwe Hollandse Waterlinie - Gorinchem
http://www.boeringa.demon.nl/OSM/OSM_TheNetherlands_NHW_Gorinchem_1_25000.zip